Quickstart
Install TensorFlow3d Transforms:
pip install tensorflow3dtransforms
You can now try out any of the method examples in the documentation. Here are a few starter example you could try out:
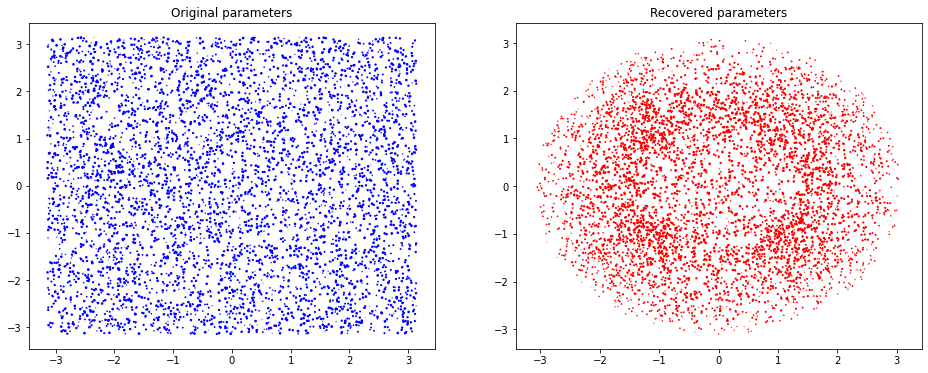
Define a set of random rotations and use the exponential map to map the parameters to matrices in SO(3). After which we use the logarithmic map to map the matrices back to parameters to identify any relations. We now briefly show what happens in this example:
A rotation matrix \(R\) in 3D space can be parameterized using logarithmic map or exponential map of a 3D vector \(\theta\). Exponential map of a 3D vector \(\theta\) is calculated as:
where \(I\) is the identity matrix.
We then compute the logarithmic map of a rotation matrix \(R\) which is the inverse operation of exponential map. The logarithmic map of \(R\) is calculated as:
where \(A = \left[R_{32}-R_{23}, R_{13}-R_{31}, R_{21}-R_{12}\right]^T\)
The code examples below shows this in action with the TensorFlow3d Transforms library on 10,000 points.
import tensorflow3d_transforms as t3d
import tensorflow as tf
import numpy as np
import matplotlib.pyplot as plt
from mpl_toolkits.mplot3d import Axes3D

thetas = tf.random.uniform(shape=(10000, 3), minval=-np.pi, maxval=np.pi)
Rs = t3d.so3_exp_map(thetas)
thetas_recovered = t3d.so3_log_map(Rs)

fig, ax = plt.subplots(1, 2, figsize=(16, 6))
ax[0].scatter(thetas[:, 0], thetas[:, 1], thetas[:, 2], c="blue")
ax[1].scatter(
    thetas_recovered[:, 0], thetas_recovered[:, 1], thetas_recovered[:, 2], c="red"
)
ax[0].set_title("Original parameters")
ax[1].set_title("Recovered parameters")
plt.show()
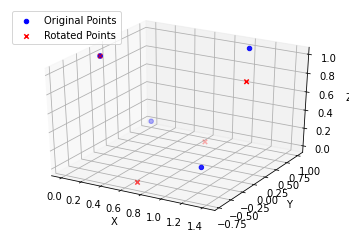
We calculate a 3D rotation matrix \(R\) is calculated using the
axis_angle_to_matrixfunction from thetensorflow3dtransformslibrary. A set of points points are then transformed by this rotation matrix to obtain their rotated versions.
The conversion from axis-angle representation to rotation matrix is done using:
where \(u_x\), \(u_y\), \(u_z\) are the components of the unit vector axis and \(\theta\) is the angle of rotation.
The code examples below shows this in action with the TensorFlow3d Transforms library.
import tensorflow3d_transforms as t3d
import numpy as np
import matplotlib.pyplot as plt
from mpl_toolkits.mplot3d import Axes3D

axis = np.array([0, 0, 1])  # Z-axis
angle = np.pi / 4  # 45 degrees

R = axis_angle_to_matrix(axis * angle)
points = np.array([[1, 0, 0], [0, 1, 0], [0, 0, 1], [1, 1, 1]])
rotated_points = np.dot(points, R)

fig = plt.figure()
ax = fig.add_subplot(111, projection="3d")
ax.scatter(
    points[:, 0], points[:, 1], points[:, 2], c="b", marker="o", label="Original Points"
)
ax.scatter(
    rotated_points[:, 0],
    rotated_points[:, 1],
    rotated_points[:, 2],
    c="r",
    marker="x",
    label="Rotated Points",
)

# Add labels and show the plot
plt.legend(loc="upper left")
ax.set_xlabel("X")
ax.set_ylabel("Y")
ax.set_zlabel("Z")
plt.show()
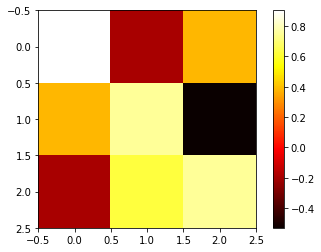
Here’s an example of visualizing a 3D rotation map as a heatmap.
import tensorflow3d_transforms as t3d
import numpy as np
import matplotlib.pyplot as plt

axis = np.array([1, 1, 1])
axis = axis / np.linalg.norm(axis)
angle = np.pi / 4
R = t3d.axis_angle_to_matrix(axis * angle)

fig, ax = plt.subplots()
im = ax.imshow(R, cmap='hot')
fig.colorbar(im)
plt.show()
These were some examples just to get you started with using some of the APIs in this library, and there are a lot more possibilities to what you could do with the library.